Generated with AI
Map
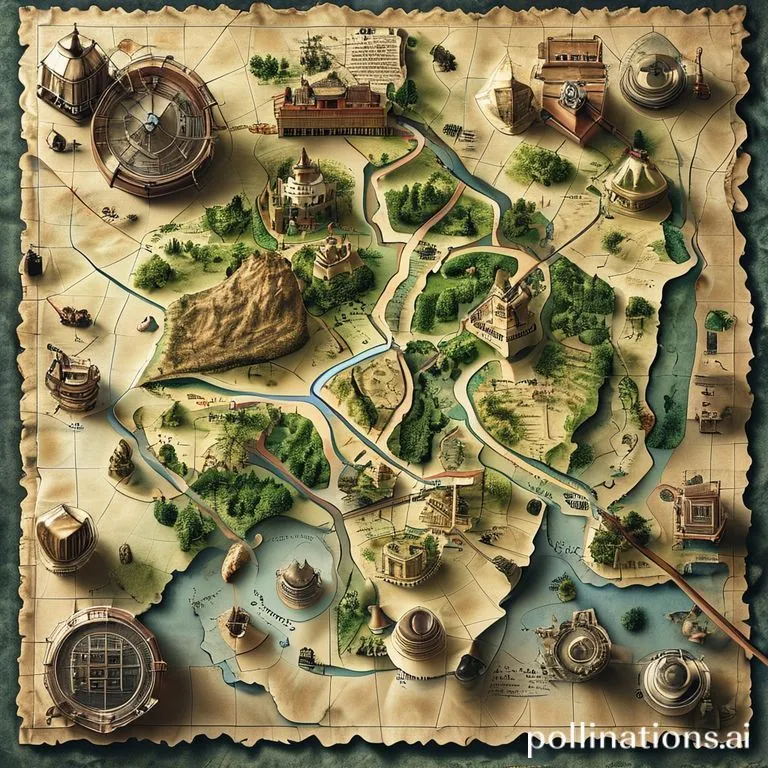
Brief description
A symbolic depiction highlighting relationships between elements of some space, such as objects, regions, and themes. Most commonly, it is a two-dimensional representation of a three-dimensional area (the Earth).
Use / Function
- Navigation: Finding routes from one place to another.
- Planning: Urban planning, military strategy, resource management.
- Record Keeping: Documenting boundaries, ownership, and terrain features.
- Education: Understanding geography and spatial relationships.
Operating principle
- Projection: Mathematical transformation of locations on the curved surface of Earth to a flat surface.
- Scale: The ratio of a distance on the map to the corresponding distance on the ground (e.g., 1:10,000).
- Symbology: Use of standardized icons and colors to represent features (blue for water, green for forests, lines for roads).
How to create it
Basic Mapping (Surveying)
- Establish a Baseline: Measure a straight line distance between two points accurately on the ground using a rope or chain.
- Triangulation: From each end of the baseline, measure the angle to a third point using a sighting device (like a compass or alidade). This fixes the third point’s position.
- Traverse: Walk a path, measuring the length and direction (bearing) of each leg.
- Plotting: Transfer these measurements to paper using a scale and a protractor/ruler.
- Detailing: Sketch in features (rivers, coastlines) relative to your fixed points.
Materials needed
- Surface: Paper, Parchment, Papyrus, Clay tablet, or Cloth.
- Marking: Ink, Charcoal, Graphite.
- Measuring Tools: Ropes/Chains (for distance), Compass (for direction), Ruler.
- Drawing Tools: Pens, brushes, straightedge.
Variants and improvements
- Topographic Map: Uses contour lines to show elevation and terrain shape.
- Thematic Map: Focuses on specific information (population, climate, resources).
- Nautical Chart: Specialized for maritime navigation, showing depths and hazards.
- Star Chart: A map of the night sky.
Limits and risks
- Distortion: Every flat map of a curved surface introduces distortion in either area, shape, distance, or direction.
- Accuracy: A map is only as good as the survey data used to create it.
- Obsolescence: Terrain and political borders change; old maps can be misleading.
- Bias: Maps can be drawn to emphasize or hide certain features for political or propaganda purposes.